What is a Gantt Chart?

Today, the software development industry is booming at a fast pace. With the progress of the developmental process, the need for practical project management tools is also increasing.
Managing projects is a complex process that involves various tasks, resources, and risks. To manage those projects, teams use various management software and tools.
One popular project management tool is the Gantt chart.
Gantt chart is a powerful project management tool that enables project management teams to monitor the progress of their projects. It is a graphical representation of the project timeline that shows the start and end dates of the project tasks. This blog post discusses Gantt chard and its various aspects to better understand this tool.
What is a Gantt Chart?
It is a tool that enables project management teams to plan the entire project. It comprises two sections. The left section enlists all the project tasks, and the right area comes with a timeline. Each task corresponds to a bar in the timeline.
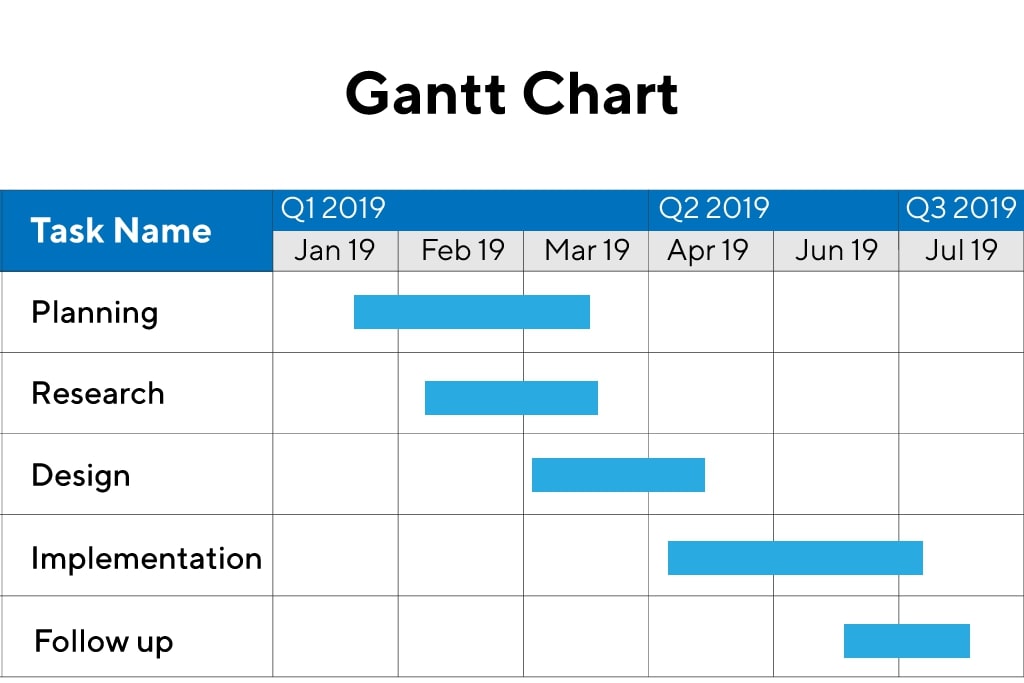
Credits: Product Plan
The length of the bar shows the duration of the task. It includes the initiation and ending duration of the task. Gantt chart also contains the milestones for various tasks. These milestones help in analyzing the progress of the project.
Origin of the Gantt Chart
Traditional, outdated tools and methodology become unsuitable for new, emerging types of projects. It takes too much time for the project management team to assess the progress of their projects.
Henry Gantt first developed the project management chart in the early 1900s. At that time, teams did not apply this technique to technology development. However, as the development of the computer took place, development teams began to use it on computers to make the project management process more efficient.
Use of Gantt Chart
Following are the common uses of the Gantt chart:
Creating Comprehensive Project
Teams find it challenging to create project plans that are both comprehensive and accurate. Gantt chart serves to develop such plans. It contains all the necessary information about the project tasks, resources, risks, and timeline.
This tool displays the interrelationships between various tasks.
It helps the project management team get a clear overview of the project and plan for it. Without building a comprehensive project plan, it is difficult to move forward with the project and achieve the desired results.
Analyzing Logistics and Task Dependencies
Gantt chart also enables project managers to analyze the logistics of their projects. It helps them identify the tasks dependent on each other.
Task dependencies enable project teams to configure the project timeline. It also avoids any unnecessary delays in the project. In doing so, it allows teams to start a new project when the previous one is complete.
Monitoring Progress
Monitoring the progress of a project is crucial to its success. Gantt chart enables project management teams to monitor the progress of their projects. It shows the overall progress of the project as well as the progress of individual tasks.
It helps teams identify any delays in the project and take corrective action. It also enables them to assess the impact of various risks on the project and take necessary measures to mitigate them.
Benefits of Gantt Chart
Gantt chart offers various benefits to project management teams. Following are some of the key benefits of using the Gantt chart:
Convenient Time Management
Managing time is one of the most important aspects of project management. Numerous projects fail as their project managers have difficulty managing time. Gantt chart helps project managers manage their time. This tool enables them to assess the progress of their projects and take the appropriate measures.
Managing and Prioritizing Tasks
Gantt chart also helps project managers to manage and prioritize their tasks. It shows the interrelationships between various tasks and enables project managers to identify the tasks that are dependent on each other.
Track The Project Progress
Tracking the progress of a project is necessary for its success. Gantt chart helps project management teams monitor the progress of their projects. It shows the overall progress of the project as well as the progress of individual tasks. It helps teams to identify any delays in the project and take corrective action.
Gantt Chart in Waterfall vs. Agile Methodologies
Let’s take a look at how to use Gantt Chart in both waterfall and agile planning.
Waterfall Project Management Approach
The waterfall management methodology is a sequential process where teams must complete each phase of the project before moving on to the next one. Teams use a Gantt chart to plan and manage waterfall projects. It helps project managers to identify the tasks that are dependent on each other and plan the project.
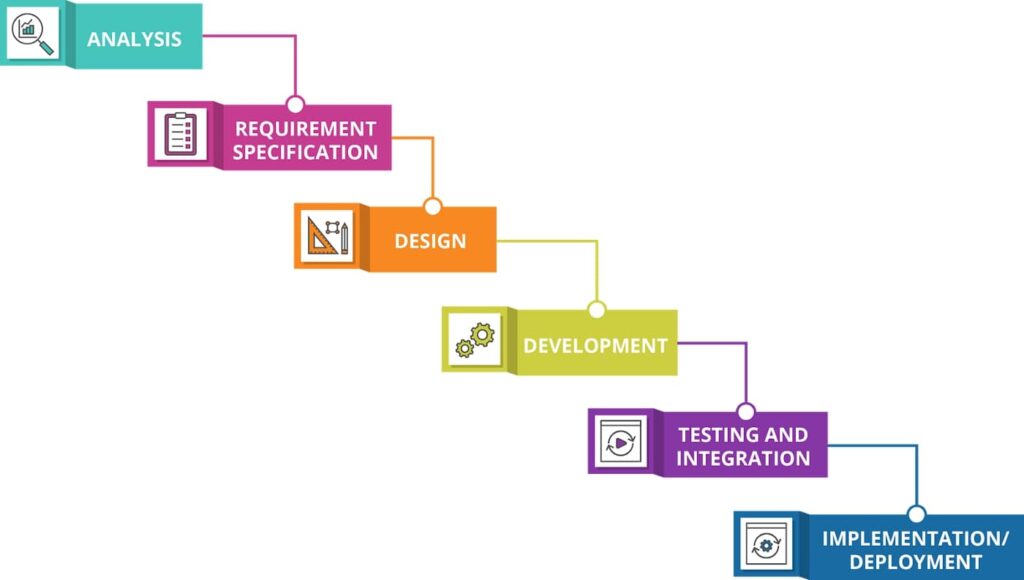
Credits: Medium
While using the Gantt chart with a waterfall approach, teams need to decide the project schedule at the beginning of the project. They make the tasks more manageable by splitting a huge project into multiple phases and milestones.
Agile Project Management Approach
The agile methodology is an iterative and incremental approach that affords teams the flexibility to change project requirements at any time. Teams use Gantt chart to plan and manage agile projects. It helps project managers to track the progress of their projects and take corrective action accordingly.
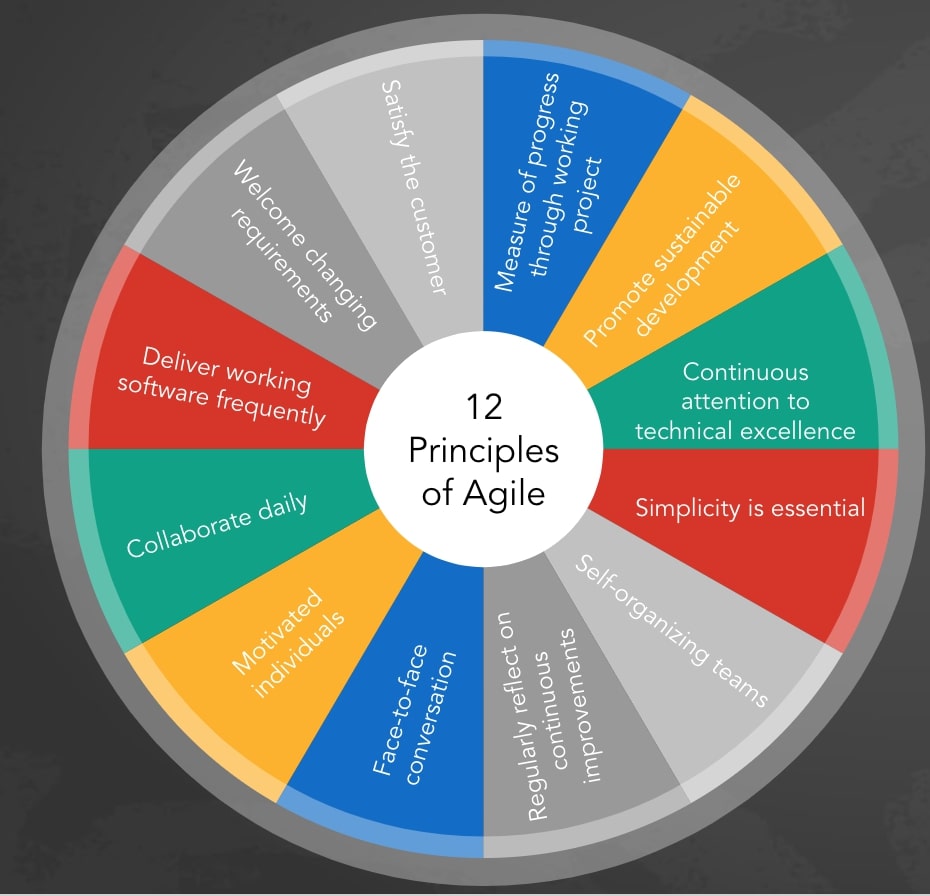
While using the Gantt chart with an agile approach, teams need to update the chart regularly. They make the tasks more manageable by breaking them down into smaller chunks.
A project development team plans the work at the beginning of a sprint and uses the Gantt chart to track the progress of their tasks. At the end of each sprint, they review the chart and update it for the next sprint.
Use Gantt Chart Today
Project development teams have been using this project management tool for years.
Whether your organization is using a waterfall approach, agile method, or any other management approach, use a Gantt chart for your project.
Feel free to use Gantt chart software for planning and scheduling projects.


