How to use Scrum Metrics to Boost Team Performance

Scrum metrics are various data points and statistics that Scrum teams record, track, and analyze to help boost team effectiveness, performance, and efficiency.
Agile teams need key Agile metrics to inform their decision-making. It helps create clearer goals and facilitates better sprint management.
A team’s performance hinges on these metrics. It is the job of the Scrum team to monitor and analyze metrics after every sprint for maximum efficiency.
In this article, we go over 7 scrum metrics and Agile teams use them to gauge progress along the development cycle.
7 Scrums Metrics for Better Performance
Traditional project management uses key performance indicators (KPIs) and milestones to measure project progress.
However, in Agile Scrum projects, the milestones don’t always guarantee the team’s progress.
Instead, these milestones and metrics allow team members to keep track of what they’re doing and determine how close they are to meeting their goals.
The agile framework relies on a few scrum metrics to do this.
Since the metrics are, in essence, team forecasts and are there to improve team productivity, the Scrum team chooses them on their own.
The development team understands and manages most of the key metrics. However, the scrum master has to oversee everything and manage the sprint planning meeting. Meanwhile, the product owner and project managers assist the entire team.
The Scrum master, development team, and product owner decide and agree on a set of metrics. They then track these metrics and define how to use each of them.
These metrics vary from product to product. They include.
- Customer Satisfaction – The customer satisfaction score (CSAT) and net promoter score (NPS) help determine how successful a project is according to users. It tells the scrum team’s value to your customers.
- Return on Investment (ROI) – Overall growth in monthly active revenue (MAU) is a great way of convincing internal stakeholders of the value of agile methodology.
- Team Satisfaction – It’s crucial to keep track of the team’s motivation and happiness to avoid turnover, quality deterioration, and deadline mishaps.
Moving on, the following Scrum metrics allow for greater team efficiency in any Scrum project.
1. Team Velocity
Also known as sprint velocity, the team velocity is the total amount of work the team completes during the current sprint.
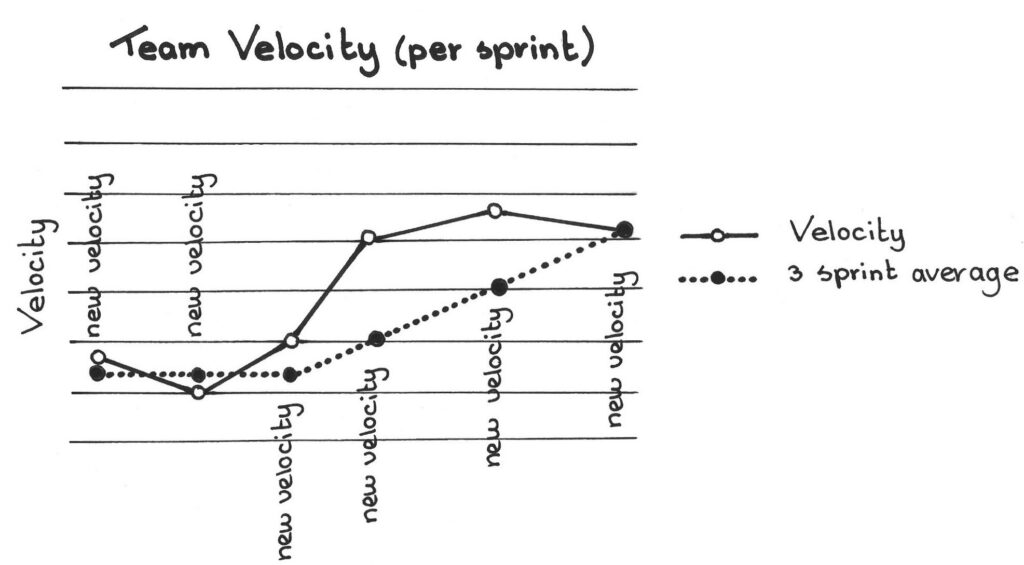
Credits: Scrumbook
If you’re keeping track of previous sprints, it’s easier to predict the Scrum team’s ability to meet deadlines. It also tells you how the Scrum team operates, as well as the time it takes for them to complete a given task.
For a technical definition, velocity is the rate your team delivers work and how many story points they close within a given time period. The total number of story points completed doesn’t matter. Instead, the only thing that matters is how fast each team works.
It gives you an idea of the team capacity and is helpful in future sprint planning. If you estimate how much work the team completes in a given time, planning deadlines for the next sprint becomes easier.
This is all the more useful in the software development lifecycle. That’s because you get to determine the development cycle time and provide customers with the necessary updates or bug fixes.
The total hours or story points you complete help estimate the time to market, allowing for better project development.
2. Effort Estimation Variance
It’s crucial to work with absolutes when it comes to measuring your team’s performance. There is no room for over or underestimations.
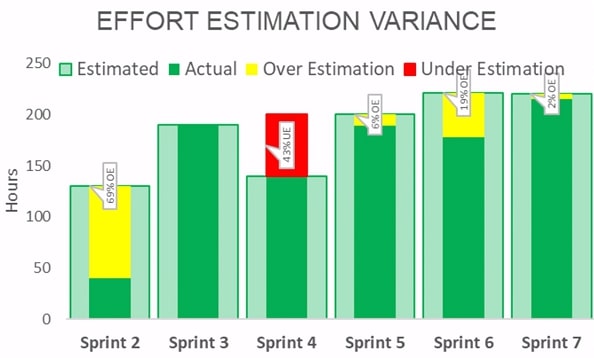
Credits: Medium
On one hand, overestimation is bound to show up new risks that throw a wrench in your project plans.
On the other handing, underestimating tasks makes it harder to maintain deadlines because you won’t evaluate the time you need.
Underestimation is the result of unfamiliarity with the product and tech stack while overestimation is the result of a lack of confidence and trust.
Calculate under and overestimation by using the following formulas:
- Underestimation = (A-E)/E*100
- Overestimation = (E-A)/E*100
In the formula, A is the actual effort and E is the estimated effort.
You get a percentage that tells you how much your team under or overestimated a sprint. That allows you to analyze the gaps and improve the performance of future sprints.
3. Sprint Burndown
Sprint burndown is the visualization of sprint progress and is crucial to Scrum Masters.
It’s a complete depiction of the Scrum team’s progress during a sprint. Sprint burndowns help you see whether the team is meeting deadlines, working per schedule, and following the sprint backlog.
It helps track each sprint goal according to the sprint scope and business objectives.
Since it’s a sprint burndown chart, it represents work down vs work that needs completion.
The x-axis of the chart shows time and the y-axis shows the work left. The most common unit of measurement is story points or hours.
Scrum Masters and development teams forecast the workload for the next sprint after a sprint review. The goal is to complete all the items in the backlog by the end of the sprint.
4. Epic and Release Burndown
Compared to the sprint burndown, epic and release burndown focus on a large workload beyond a single sprint.
During a sprint, there are several epics and versions of work. It’s crucial to track the progress of each of those variables to assess the team’s performance and improve it.
The team needs a clear idea of the epic and version workflow. The best way to do that is through epic and release burndown charts.
5. Retrospective Process Improvement
This helps determine the team’s ability to improve or revise the development process such that it becomes more enjoyable and effective in the upcoming sprint.
The sprint retrospective helps define changes that are bound to make the entire process more efficient. You get insights into the common problems during sprints. That allows you to draft an improvement action plan.
There are three things that help measure this metric:
- Total number of retrospective items identified in the sprint
- Total number of retrospective items that need addressing
- The collective number of items resolved at the end of the sprint
With this information, it becomes easier to determine what parts of the development processes must undergo changes to ensure improvement.
6. Defect Leakage
Also known as escaped defects, defect leakage allows you to track the total number of defects detected during a sprint release.
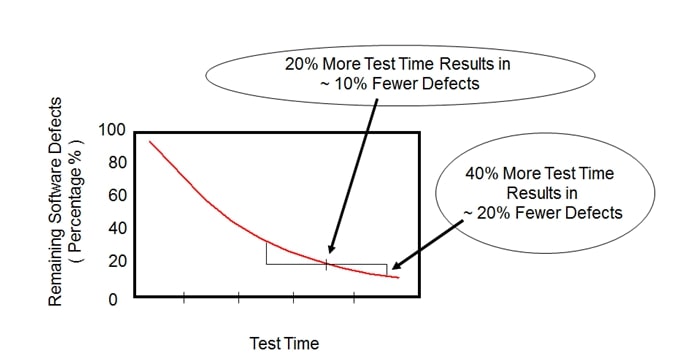
Credits: Fabres
It’s normal for the number of bugs to increase at a steady rate as your product grows.
However, how you handle that determines the long-term software quality, customer satisfaction, and final estimations.
Your software team needs a way to figure out how many defects there are to ensure customer loyalty.
This metric helps to improve the effectiveness of your quality assurance processes. It helps reduce bug transparency as the product becomes more complicated.
You calculate defect leakage using a simple formula:
Defect Leakage = (Defect Count After Sprint / Defects Detected During Sprint) * 100
Using this formula gives you the average variance in each sprint. Plug those numbers into a defect leakage chart to determine the defect volume each sprint.
7. Scope Change
The scope change metric tells you the total number of story or item changes during the project in a sprint.
There are two different factors that determine the scope change – scope increase and descope. These help you determine why and when certain changes or mistakes took place during a single or multiple sprints.
Measure both of those factors using the following formulas:
- Scope Increase = (A/C)*100
- Descope = (D/C)*100
In the formulas, A is story points added, C is story points committed, and D is story points removed.
For the most part, descoping stories happen due to changes in priorities. However, at times, this is due to a lack of preparedness of the product owner. They underestimate the requirements of an upcoming sprint.
Visualize your results in a scope change chart to track variance changes.
Scrum Metrics: Key Takeaways
Making use of Scrum events and metrics helps ensure each team member adds to the entire team’s effectiveness.
It also ensures you follow the Scrum framework to the book, maintain daily Scrum activities, and it helps complete sprints in an efficient manner.
However, you have to keep in mind that you may not require every Scrum metric. It depends on your project needs, Scrum team, and overall business objectives.


