7 Agile Metrics to Inspire You

Agile metrics are fundamental productivity indicators. They show how effective your company or team is in fulfilling its goals and principles.
Whether your goal is to satisfy your clients through the delivery of the promised product or to maintain a constant pace for work completion, choosing agile metrics tells you how well your team tackles a set of challenges.
Here are 7 agile metrics to inspire you on your quest to find the best way to utilize your resources and grow your bottom line.
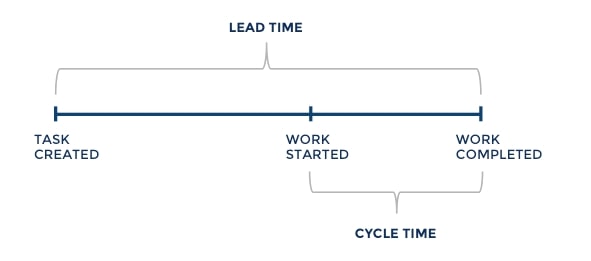
1. Cycle Time
Cycle time refers to the time it takes your development team to complete a specific task. This only includes the time spent in the active progress stage of the development process. Therefore, it excludes other phases such as the preparation period or blocked time, among others.
Credits: Screenful
Cycle times provide information about the following key factors:
Productivity: Teams with longer cycles complete fewer tasks than those with shorter cycle times.
Predictability: The consistent cycle times of Agile teams provide reliable forecasts about future cycle times. A consistent cycle time allows businesses to better plan and prepare their agile methodology.
Task size: The smaller the task is, the shorter time it takes your team to complete it. It helps identify if any tasks are too big for a team.
Possible delays: If one team has varying cycle times due to delays, analyzing their cycle metrics helps you see any lost time.
Costs: Longer cycle times mean a significant increase in production costs.
Feedback time: The longer a cycle is, the longer it takes to sell the product or service and receive feedback on its quality.
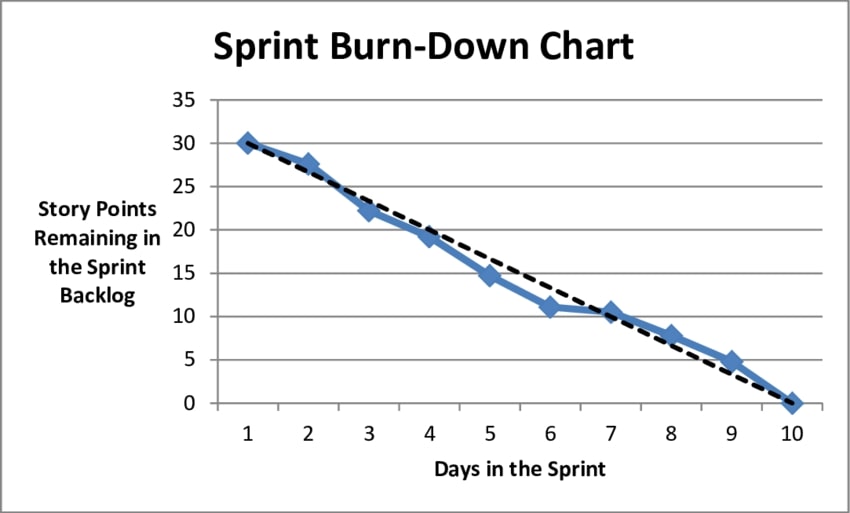
2. Sprint Burndown
Organization for each phase of a task is in units called sprints. Each team estimates completed work during a sprint, and the chart tracks the completion process and creates a finalized report.
Credits: Research Gate
The sprint burndown chart shows how many tasks a team has or hasn’t completed within this unit. The chart depicts a line that arrives at zero remaining tasks (indicating optimal progress) and another line that shows the remaining tasks (the actual burndown).
Sprint planning is one of the easiest agile metrics to use and helps to ensure consistent performance. Its transparency allows any team member to see whether they are on track to reaching other target numbers and track the team’s progress.
In addition, the chart reveals whether the team’s speed is constant during the entire sprint, making it one of the most important agile metrics.
If a team’s speed increases or decreases within the given time unit, that implies that there are further issues you need to look into. After all, a sprint burndown report on its own isn’t a reliable indicator of your team’s performance levels.
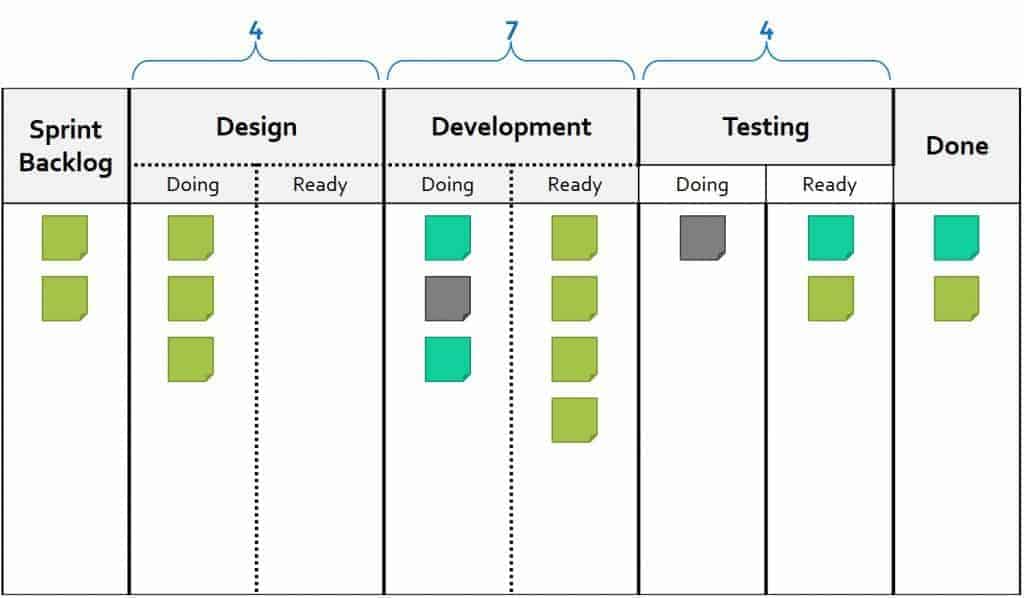
3. Work in Progress
Work in Progress, or WIP, is the total number of tasks agile teams are working on within a set amount of time. By calculating how many items fit in the WIP timeframe and taking on only a number of tasks within this limit, your team establishes a continuous workflow.
Credits: Agile Sparks
Higher WIP means that a team takes on too many projects, which leads to low-efficiency levels. On the other hand, if the WIP is low, this means that workflow is quick and your team is productive, as no one has to lose time switching between too many tasks.
This metric indicates that there has to be a maximum number of projects that a team handles at any given time. Before adding a new one to the agenda, you need completion of the previous project.
This is one of the standard key performance indicators for agile project management and is useful for improving team performance.
4. Velocity
Velocity is the amount of work a team completes in a given period. Measurement for this number is per Sprint for productivity and budget forecasting.
As with all agile metrics, the benefits of velocity depend on how you take measurements and how you want to use the data you’ve gathered. For example, use it to look for specific issues or problem areas. But low and high numbers indicate potential issues.
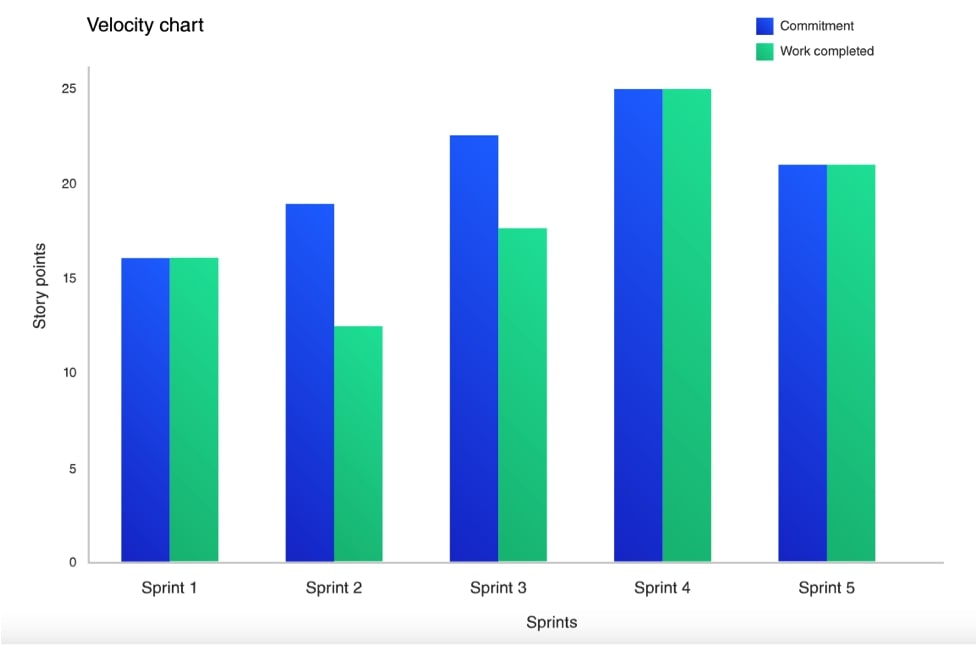
Credits: Workfront
Start-ups have low velocity and as they learn to optimize teamwork and work processes. However, keeping up velocity for the sake of it is counterproductive and detrimental to the morale and the productivity of your teams.
5. Lead Time
Lead time is the period from creation to completion. This includes the start time of tasks in your backlog, cycle time, and the time it takes for your items to get into the customers’ hands.
The importance of Lead Time lies in keeping your backlogs clean. It’s easy to fall behind with your tasks when juggling several different projects and need the backlog to prioritize which ones you do first.
With lead time agile metrics, you create a schedule that allows you to clear off items from your backlog in a timely manner.
6. Blocked Time
Blocked time refers to a time frame during which an item doesn’t move forward in the procession line.
The lack of a complimentary item from a different production line causes this or an issue outside your control.
Blocked time is often measured in days. However, in the case of critical items, measurement is in hours or story points. Story points are a better way to measure any of the above metrics.
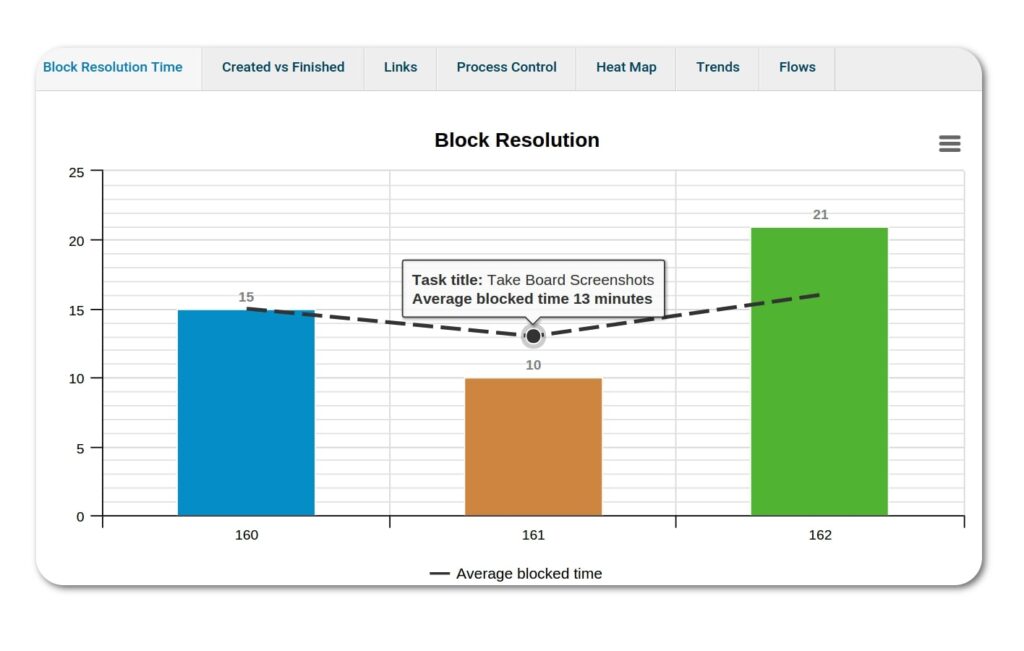
Credits: Kanbanize
Not only is this metric an ideal measure of bottleneck effects, but it reveals the root causes of every issue. Teams then organize blocked tasks by causes, add them up, and analyze the agile metrics for each of them. This allows your team to see where the problem areas in your production line are and implement the necessary improvements.
The insight provided by blocked time even grants you the opportunity to deal with causes that are outside your control. For example, the metric shows that some items get stuck because one of the distributors you work with doesn’t deliver on time. In this case, looking for a different provider saves you a lot of money and time.
7. Cumulative Flow
The Cumulative Flow Diagram (CBD) is an agile metric that compiles data from several different agile metrics. The bands on the diagram are smooth but any difference in their shape or size indicates a potential issue with the entire process.
If a band on a CFD widens for certain items or teams, the completion process takes much longer than usual. If the band becomes narrow, completion of some tasks is much faster than the allocated time. Blocking issues lead to both scenarios, as do unchecked backlogs.
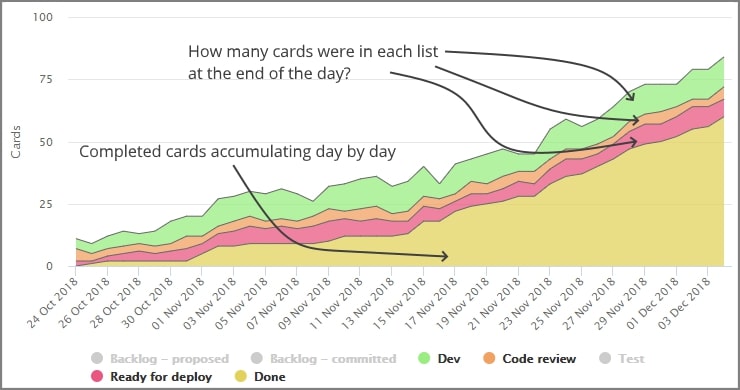
Credits: Blue Cat Reports
The latter stems from issues that don’t appear in feedback or are too insignificant to address. If a band increases in steady lock steps, completion of tasks at an equal rate, and you have the optimal production time.
Since CFD includes complex data, understanding it is challenging at first before you harvest crucial agile project metrics. Whether you need Cycle Time, WIP, or anything else, all you need to do is create a CFD using all your data. You learn what issues are the most common in our company and eliminate them as soon as possible.
Agile Metrics: Final Thoughts
Whether you use agile metrics, lean metrics, or any other metrics, you must remember to use the numbers to benefit the entire team. The focus on realistic predictability and increased productivity is for all operational levels.
This help improves everyone’s work over time, which you’ll convert into financial gain. That said, agile metrics represent only one part of successful teamwork.
Employee feedback and a strong customer satisfaction score on your products or services is important for establishing trust in your company.


