B2B Cohort Analysis

In our previous article, we discussed cohort analyses in the business-to-consumer (B2C) product space. We first broke down how cohort analyses enable you to see the difference between groups of users. Then, we discussed how cohort analyses enable you to drive insights from real-time experimentation.
While cohort analyses are incredibly powerful in the B2C space, they’re quite difficult to pull off in the B2B (business-to-business) space.
Why is that?
It’s because B2B products display a couple of fundamental structural differences compared to B2C products.
In fact, I wasn’t aware of the differences between B2B cohort analyses and B2C cohort analyses until I worked alongside Ying Luo, Product Analyst at Blend!
Ying and I tackled an actual B2B cohort analysis to better understand how loan officers engage with Blend over time. Based on those learnings, I’ve crafted a hypothetical set of examples that highlight the challenges of B2B cohort analysis.
In this article, I’ll first walk through how B2B products are different from B2C and how that makes cohort analyses difficult – as Ying and I can attest to from firsthand knowledge.
From there, we’ll discuss how to mitigate those challenges to drive actionable insights through B2B cohort analysis. Let’s dive in!
B2B Cohort Analysis vs. B2C Cohort Analysis
B2C cohort analyses are pretty straightforward because your product usually gets a large, steady flow of user volume and regular engagement.
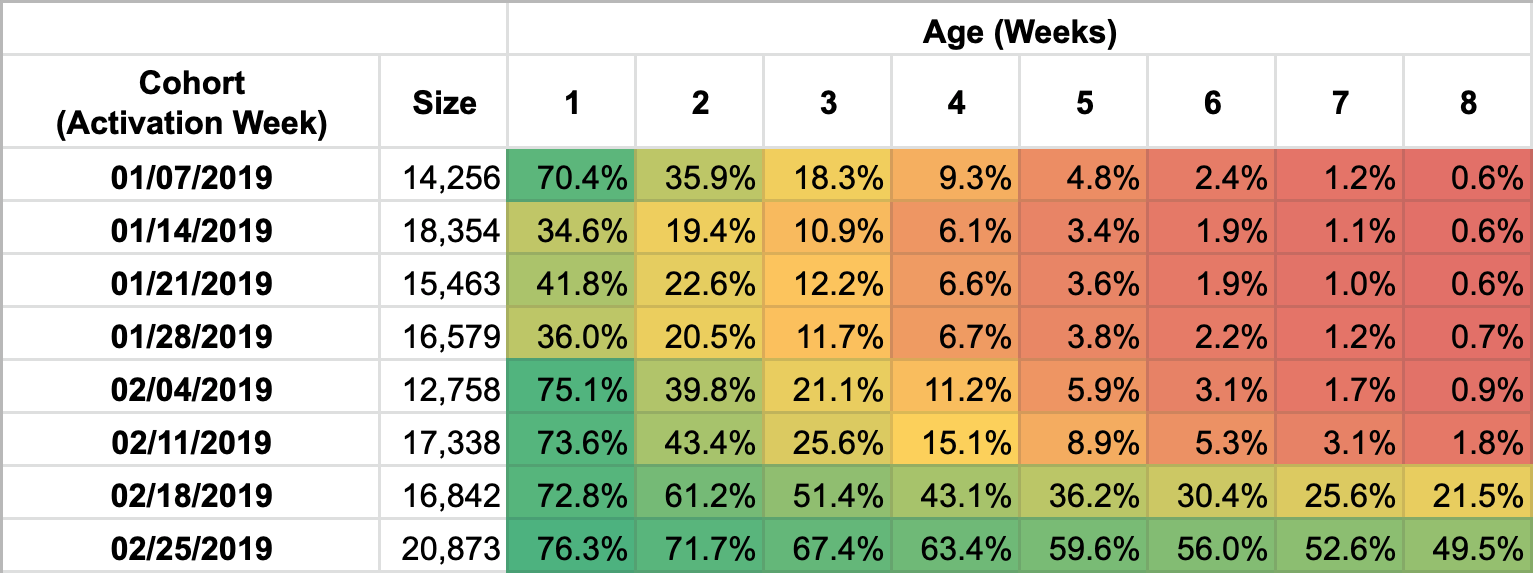
In other words, it’s easy to segment your user base by their activation date to get a cohort analysis that looks like the below chart. Note that cohort sizes are large and that trends are easy to see over time.
However, enterprise B2B products wind up violating the following assumptions:
- Continuous flow of new users: B2B usually has “go live dates” or rollouts, where large numbers of users will join at a single point in time.
- Frequent usage: many B2B products don’t have daily use cases the way that B2C products or might
Why is that problematic for cohort analysis?
First, when you violate continuous flow, you can no longer reliably cohort by time.
If you cohort by time, each cohort size becomes highly variable, and each cohort by time is heavily biased towards a particular subset of customers.
In other words, when you conduct B2C cohort analysis, you can generally assume that the key difference between each cohort is the state of the product itself.
But, in B2B cohort analysis, you also have to take the composition of the cohort itself into consideration.
Here’s an example. Say that you onboarded ABC Firm over this time period onto your B2B product:
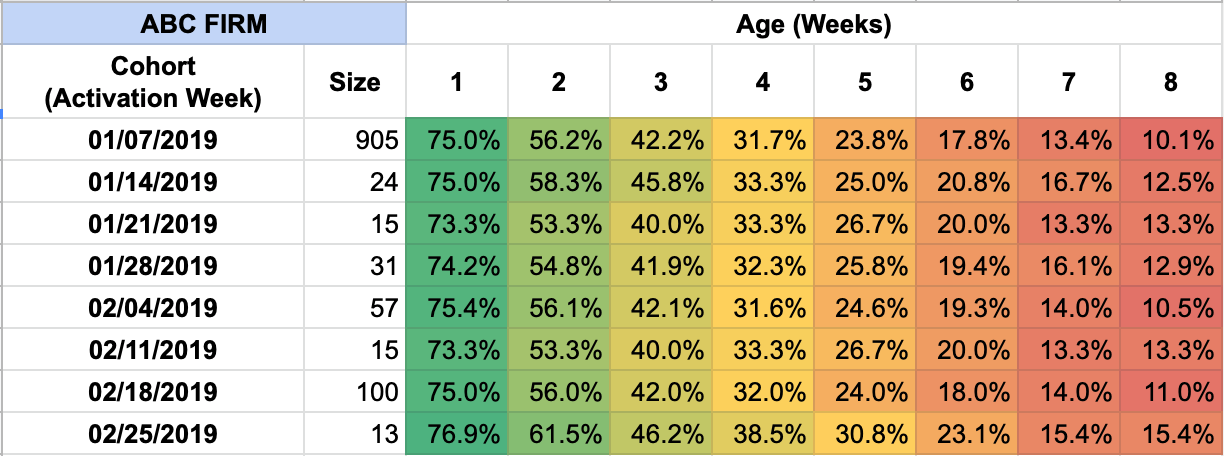
Notice that for ABC Firm, each cohort performs nearly identically.
In other words, if you only look at ABC Firm, you can conclude that any product enhancements you shipped over these 8 weeks didn’t seem to make an impact on engagement.
Also, notice that the largest spike of users from ABC Firm came in Week 1. This distinction will be important in a bit!
Now say that you onboarded XYZ Corp product over this time period onto your B2B product:

For XYZ Corp, each cohort also performs nearly identically.
In other words, if you only look at XYZ Corp, you can conclude that any product enhancements you shipped also didn’t seem to make an impact on engagement.
Notice also that XYZ Corp users tend not to engage as much as ABC Firm users do.
For example, every ABC Firm cohort has somewhere close to 75% engagement in their first week, but every XYZ Corp cohort has only somewhere close to 60% engagement in their first week.
Also, notice that the largest spike of users from XYZ Corp came in Week 8.
What happens if we aggregate this analysis together? Well, we wind up with the following result:

Without the underlying context of each individual firm, you might be tempted to conclude that your product was better in Week 1 than it was in Week 8, because the Week 1 cohort had more retention.
But in reality, the only difference was due to the underlying composition of users!
In other words, the user base that makes up each cohort is fundamentally different.
ABC Firm users are naturally more engaged than XYZ Corp no matter how your product actually performs.
You just happened to have more ABC Firm users in the first cohort than you did in the final one.
Therefore, it’s hard to cohort by time for B2B products, unlike in B2C.
Second, when you violate frequent usage, it means that it’s hard to accurately track day-over-day or week-over-week engagement, and you may need to use much larger granularities of activity.
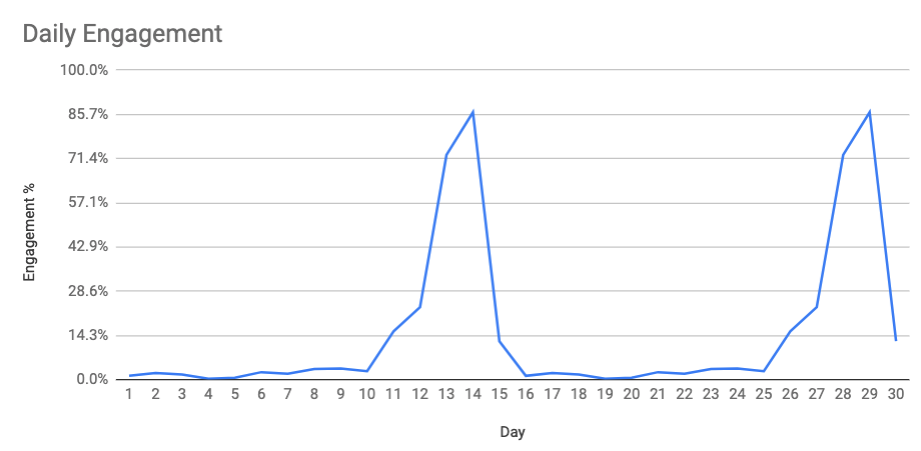
For example, let’s say that your product is only used by finance teams to complete payroll, which happens every two weeks. You might wind up with a daily engagement graph that looks like this:
If you tried to conduct a cohort analysis on a day-by-day basis, you might wind up with this nonsensical result:
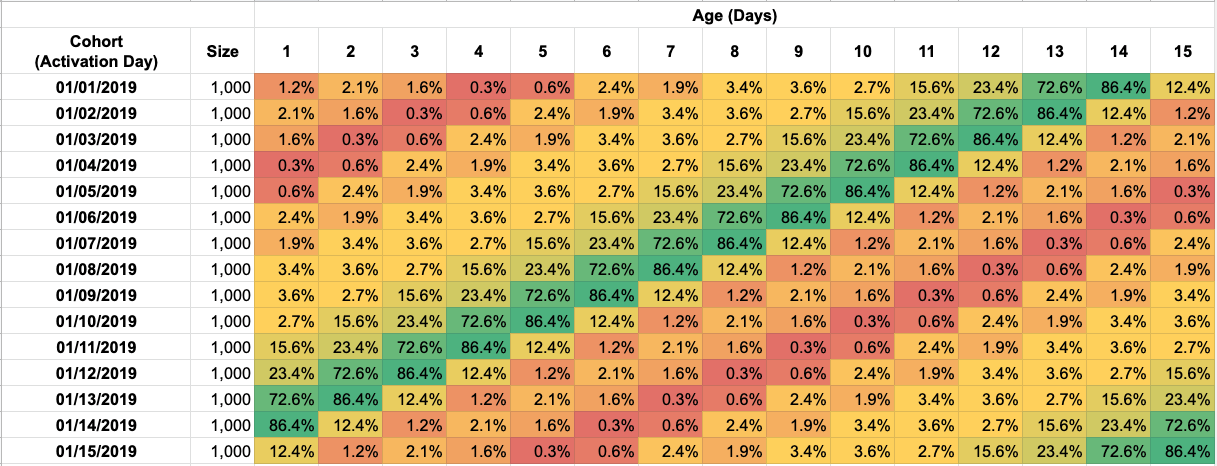
The data fluctuates too much from each day cut, so even though every cohort behaves the same way (lots of activity on the 14th and the 30th of each month), you have no way to tell whether the cohorts are behaving differently from one another.
So, B2B cohorts shouldn’t be cohorted on a calendar basis, and each time slice needs to be less granular.
Yet, cohort analyses are still incredibly important in B2B!
After all, cohort analyses enable you to determine whether your product is making an impact without resorting to flawed “total metric” measures.
So, how might you cohort in B2B instead? Check out what the product experts from the PMHQ community say.

Cohorting Best Practices for B2B Cohort Analysis
If you cohort in the following ways for a B2B product, you’ll be able to yield unique and actionable insight:
- Cohort by customer attributes (size, business model, plan)
- Cohort by user role
First, cohorting by customer attributes enables you to look across the different customer segments that you serve in B2B.
For example, say your product is a marketing enablement platform.
You may want to cohort the customers who have centralized marketing teams against the customers who have distributed marketing teams, because each one likely has different needs. Is your product more effective for centralized teams or for distributed teams?
Additionally, I’ve found that cohorting by customer size is a great way to understand whether you’re better at serving the largest customers in your market, or whether you’re better at serving much smaller organizations.
It’s crucial that you understand your product’s performance at a niche-by-niche level, since that then determines how to prioritize your roadmap to best serve the niches that you about!
Remember that your success as a product manager depends on product / market fit, which itself depends on both the product you’ve created and the market that you’re targeting.
Furthermore, cohorting by the type of plan that the customer has purchased is a good way to determine whether the various tiers of your product are performing differently from one another.
For example, say that you offer your product in two different flavors: in an “enterprise” bundle, and as an “a la carte” set of mix-and-match features.
Which flavor is driving the most retention and therefore the most value?
You wouldn’t be able to tell unless you used cohort analyses to break out these two fundamentally different customer segments!
On top of that, you don’t have to limit yourself to cohorting by customer type for B2B products. You can also cohort by user role.
Here’s an example – say that you’re a product manager at Salesforce. You have a couple of different roles on the platform: administrators, sales managers, salespeople, marketers, and business operations analysts.
You should cohort by user roles, so that you can tell whether your product is affecting them differently.
That way, when you ship a change, you can determine how it impacted each of the roles.
Then, based on that insight, you can decide whether to double down or to pivot for that feature.
After all, B2B products are complex because they enable businesses to operate.
It’s inevitable that some enhancement you deliver will wind up empowering one role while adversely impacting some other role.
Therefore, it helps to have cohort analyses available to determine whether those tradeoffs are worth it!
Time Slicing Best Practices for B2B Cohort Analysis
Remember that cohort analyses rely on two axes – the cohorts (how you split apart different groups) and the time slice (how often you re-evaluate each cohort).
We’ve discussed how to cohort more effectively for B2B. Now, let’s talk about how to slice time more effectively as well.
Consider leveraging the following techniques to reduce bias in your analysis:
- Slice time in larger chunks
- Align times to significant events
First, reading events on longer time horizons enables you to reduce the noise in your analysis.
Remember our previous example where finance users might only engage every 2 weeks? A daily or weekly time slice is too noisy to yield any meaningful insight.
One concern I regularly hear is that if you use larger time chunks, you might miss out on critical insights that happen on smaller time scales.
While it’s a valid concern, keep in mind that businesses typically need to take time to adopt the features of your B2B product.
Therefore, daily or weekly time slices are often not valid in the enterprise space.
Second, when determining how to set up your analysis, you should baseline times against significant events for each customer.
Set the initial time slice t = 0 to some significant event that the customer has experienced instead of a calendar date.
As an example, consider national rollout date.
Calendar dates don’t tell you how long users have been working with your product.
“# of days since national rollout” does tell you that information, however! Therefore, it’s a better mechanism to use for observing the health of the cohort.
Summary
While B2B cohort analysis is hard, it can be incredibly rewarding!
B2B cohort analysis enables you to determine how engagement and retention differ across segments and across time.
To drive bias out of your analysis, you should consider both axes: the cohort and the time slice.
Consider cohorting by customer attribute or by user role rather than by activation date.
When slicing by time, consider larger time slices, and consider indexing times to significant events that happen for each customer.
With these tips in mind, you’ll yield more insight for your B2B product!
About Our Contributors
Ying Luo is a Product Analyst at Blend.
Have thoughts that you’d like to contribute around B2B cohort analyses? Chat with other product managers around the world in our PMHQ Community!


